
Implementing Pie Chart in Asp.Net MVC
Pie Chart in Asp.Net MVC using AM Chart 4
So for implementing charts in asp.net mvc you have to add following library in your view
  <script src="//cdn.amcharts.com/lib/4/core.js"></script>
        <script src="//cdn.amcharts.com/lib/4/charts.js"></script>
Here , you can copy following code to the view for creating charts, here first code we are using to create chart from static javascript array and the second one will be from server side data. You can copy the following code on the view.
@using Newtonsoft.Json
@model List<PieChart.Controllers.FuelData>
@{
    ViewBag.Title = "Home Page";
}

<main>
    <section class="row" aria-labelledby="aspnetTitle">
        <h1 id="title">ASP.NET AM Charts</h1>


        <script src="//cdn.amcharts.com/lib/4/core.js"></script>
        <script src="//cdn.amcharts.com/lib/4/charts.js"></script>
        <h1 id="title">Pie Chart using Client Side data source</h1>
        <div id="chartdiv" style="width: 100%; height: 400px;"></div>

        <h1 id="title">Pie Chart using Server Side data source</h1>
        <div id="chartdiv2" style="width: 100%; height: 400px;"></div>
        <script>
        // Create chart instance
        var chart = am4core.create("chartdiv", am4charts.PieChart);
         var allTypesData = JSON.parse('@Html.Raw(JsonConvert.SerializeObject(Model))');
        // Add data

        chart.data = [{
            "country": "Lithuania",
            "litres": 501.9
        }, {
            "country": "Czech Republic",
            "litres": 301.9
        }, {
            "country": "Ireland",
            "litres": 201.1
        }, {
            "country": "Germany",
            "litres": 165.8
        }, {
            "country": "Australia",
            "litres": 139.9
        }, {
            "country": "Austria",
            "litres": 128.3
        }, {
            "country": "UK",
            "litres": 99
        }, {
            "country": "Belgium",
            "litres": 60
        }, {
            "country": "The Netherlands",
            "litres": 50
        }];

        // Add and configure Series
        var pieSeries = chart.series.push(new am4charts.PieSeries());
        pieSeries.dataFields.value = "litres";
        pieSeries.dataFields.category = "country";


         var chart2 = am4core.create("chartdiv2", am4charts.PieChart);
         var allTypesData = JSON.parse('@Html.Raw(JsonConvert.SerializeObject(Model))');
        // Add data
        chart2.data = allTypesData;


        // Add and configure Series
        var pieSeries2 = chart2.series.push(new am4charts.PieSeries());
        pieSeries2.dataFields.value = "litres";
        pieSeries2.dataFields.category = "country";
        </script>
    </section>
</main>
Now , if you just want the client side data chart then you can simply use
  <script>
        // Create chart instance
        var chart = am4core.create("chartdiv", am4charts.PieChart);


        chart.data = [{
            "country": "Lithuania",
            "litres": 501.9
        }, {
            "country": "Czech Republic",
            "litres": 301.9
        }, {
            "country": "Ireland",
            "litres": 201.1
        }, {
            "country": "Germany",
            "litres": 165.8
        }];

        // Add and configure Series
        var pieSeries = chart.series.push(new am4charts.PieSeries());
        pieSeries.dataFields.value = "litres";
        pieSeries.dataFields.category = "country";
	</script>
So , Now for server side you can use following code
using System;
using System.Collections.Generic;
using System.Linq;
using System.Web;
using System.Web.Mvc;

namespace PieChart.Controllers
{
    public class HomeController : Controller
    {
        public ActionResult Index()
        {
            List<FuelData> fuelDataList = new List<FuelData>
        {
            new FuelData { country = "USA", litres = 50.5m },
            new FuelData { country = "Canada", litres = 32.2m },
            new FuelData { country = "Germany", litres = 75.9m },
            new FuelData { country = "Australia", litres = 62.4m }
        };
            return View(fuelDataList);
        }


    }

    public class FuelData
    {
        public string country { get; set; }
        public decimal litres { get; set; }
    }
}
Now , run the application and you will see pie charts created on your browser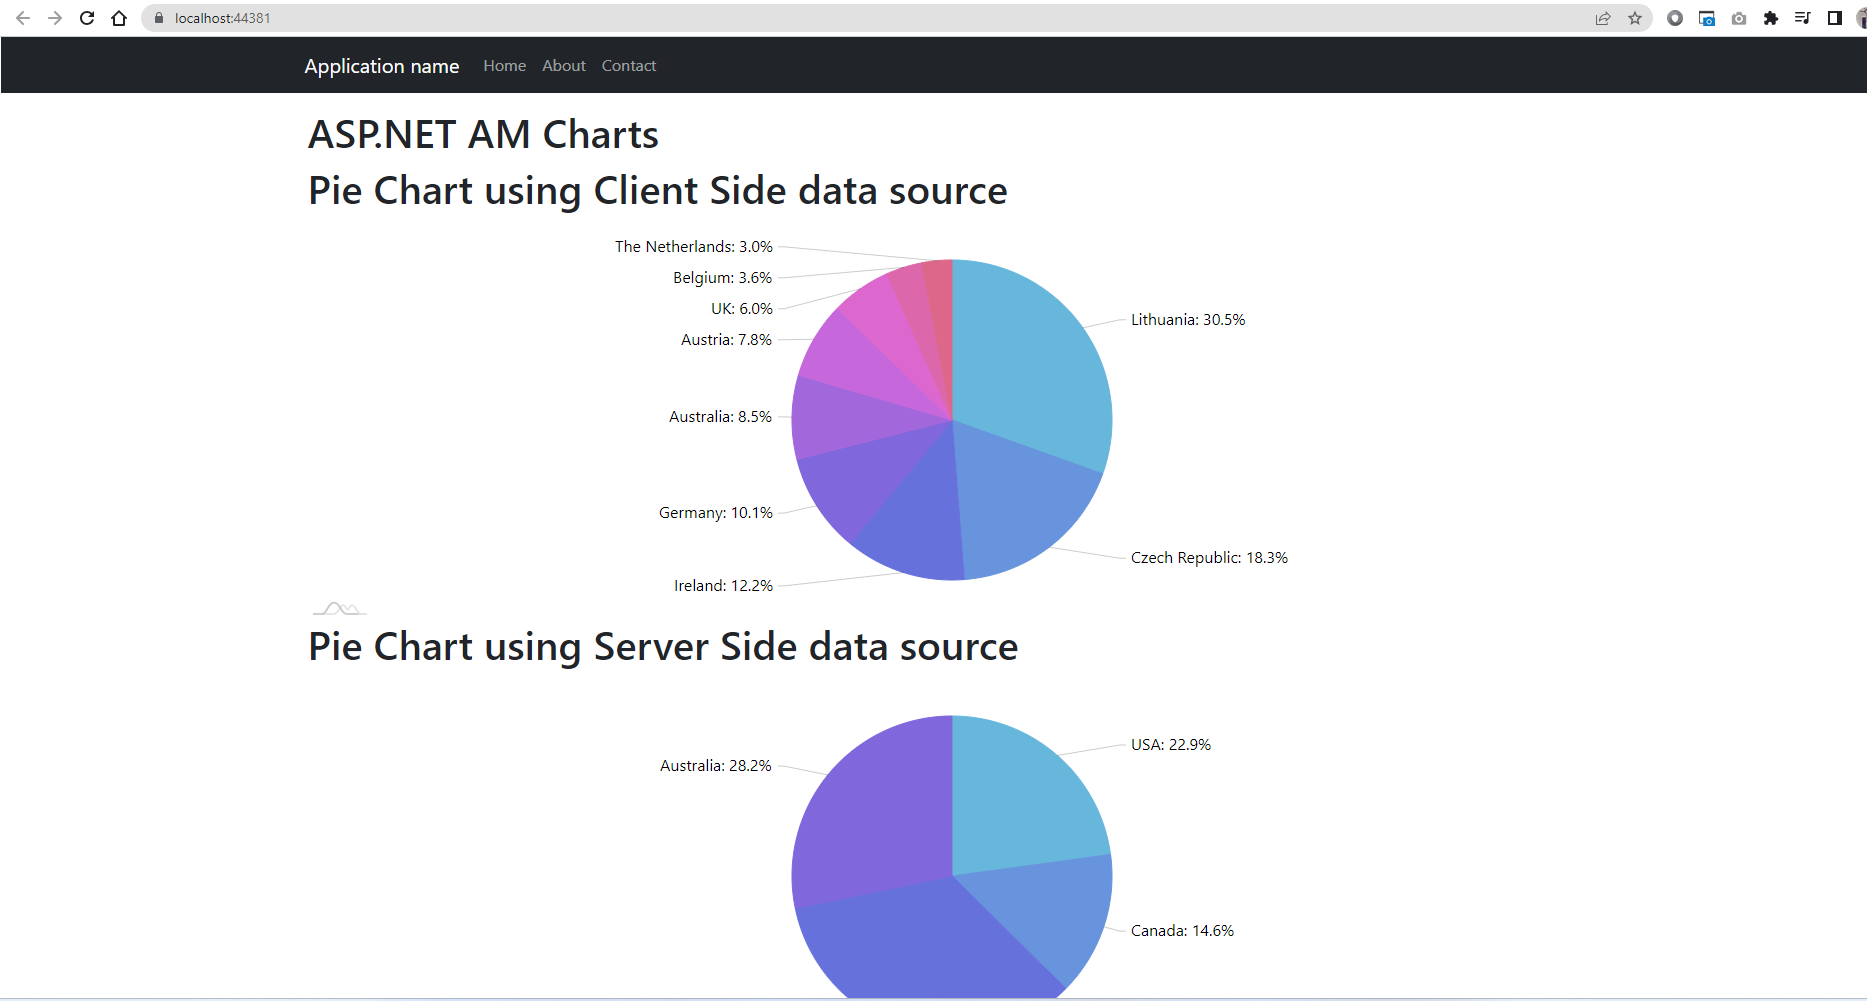
So , this is how we can implement pie chart in Asp.net mvc using AM Charts.
